



DATA & ICT · SHORT COURSE
Data Analytics with Power BI & Advanced Excel.
Many organizations collect large volumes of operational, financial, project, and performance data. However, despite having access to data, institutions often:
 Ask on WhatsAppApplications are reviewed before a place is confirmed. We reply within 1 working day.
OVERVIEW
About this course.
Many organizations collect large volumes of operational, financial, project, and performance data. However, despite having access to data, institutions often:
- Rely on manual reporting processes
- Use static spreadsheets with limited automation
- Struggle with data cleaning and consistency
- Produce delayed or inaccurate reports
- Lack interactive dashboards for management
- Fail to translate raw data into decision-ready insights
Manual reporting increases the risk of errors, delays, duplication of effort, and poor decision-making.
With growing demands for accountability, performance monitoring, and evidence-based planning, there is a strong need for practical skills in:
- Data cleaning and transformation
- Data modelling
- Automated reporting
- Interactive dashboards
- KPI tracking and visualization
This course addresses the urgent need to move from manual spreadsheet reporting to structured, automated, and insight-driven data analytics using Advanced Excel and Power BI.
COURSE CONTENT
What the programme covers.
Day 1: Data Foundations & Advanced Excel Essentials
01 Data Fundamentals
- Types of data (structured vs unstructured)
- Data quality principles
- Common data errors and inconsistencies
- Data cleaning strategies
02 Advanced Excel Tools
- Advanced formulas (IF, INDEX, MATCH, XLOOKUP)
- Logical and text functions
- Data validation
- Conditional formatting
- Sorting and filtering best practices
· Practical Session (Hands-On)
- Cleaning messy datasets
- Applying advanced formulas
- Preparing structured reporting sheets
Day 2: Excel Data Modelling & Dashboard Design
03 Pivot Tables & Analytical Techniques
- Pivot Tables and Pivot Charts
- Slicers and dynamic filtering
- Data summarization techniques
- Trend and variance analysis
04 Excel Dashboard Development
- Designing KPI dashboards
- Layout and visualization principles
- Linking multiple datasets
- Automating reports using formulas
· Practical Session (Hands-On)
- Build a financial or project monitoring dashboard
- Create automated performance reports
Day 3: Introduction to Power BI & Data Transformation
05 Power BI Fundamentals
- Power BI interface overview
- Data import from Excel and databases
- Data transformation using Power Query
- Data cleaning inside Power BI
06 Data Modelling in Power BI
- Relationships between tables
- Star schema basics
- Calculated columns and measures
- Introduction to DAX fundamentals
· Practical Session (Hands-On)
- Import and clean real datasets
- Build a structured data model
Day 4: Power BI Visualizations & KPI Reporting
07 Creating Visual Reports
- Charts and visual types
- Tables and matrix visuals
- Slicers and filters
- Drill-down functionality
- Designing management-ready dashboards
08 KPI & Performance Reporting
- Designing KPIs and performance indicators
- Budget vs actual analysis
- Trend monitoring
- Creating executive dashboards
- Publishing and sharing reports
· Practical Session (Hands-On Labs)
- Develop a full Power BI dashboard
- Create interactive performance reporting
Day 5: Automation, Insight Presentation & Capstone
09 Automating Reporting Workflows
- Linking Excel and Power BI
- Refreshing data automatically
- Report standardization
- Data governance and version control
10 Presenting Data for Decision-Making
- Storytelling with data
- Visual clarity principles
- Communicating insights to management
- Avoiding misleading visualizations
· Capstone Practical Simulation
Participants will complete an end-to-end analytics project, including
- Cleaning raw data
- Creating a data model
- Designing KPI dashboards
- Generating management-ready insights
- Presenting findings
· Course Wrap-Up
- Practical evaluation
- Feedback session
- Facilitator recommendations
- Certificate guidance
WHO IT'S FOR
Who should attend.
Target Group
This course is suitable for:
- Monitoring & Evaluation (M&E) Teams
- Finance and Budget Officers
- Statisticians
- Planning Officers
- ICT/Data Officers
- Department Heads
- Project Managers and Project Teams
- Business Analysts
- Research and Reporting Officers
Recommended Prerequisites
- Basic Excel knowledge
- Experience working with data or reports
- No prior Power BI experience required
AFTER YOU APPLY
What happens next.
BEFORE YOU APPLY
Practical information.
- Venue
- Arusha, Tanzania
- Daily hours
- 8:30 AM – 4:30 PM
- Course fee
- TZS 1,300,000 · per participant
- Fee includes
- Course materials, lunch and refreshments
- VAT
- Fee excludes VAT
- Certificate
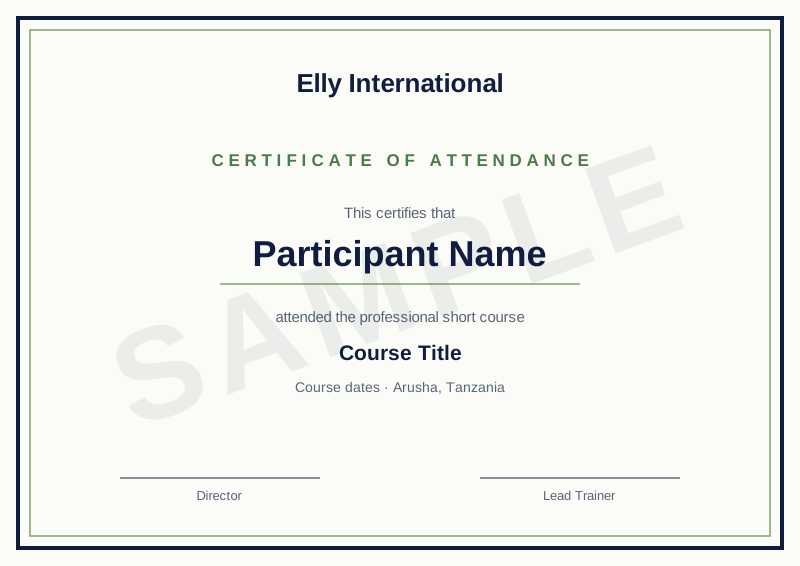
- Certificate of attendance
- Trainer
- Elly International training team
We send payment details only after your place is confirmed, and only from an @ellyinternational.co.tz email address. We will not ask you to pay into a personal account. If you are unsure, call us on +255 757 066 880 before paying.
More answers in our FAQ and booking and cancellation policy.